A deep benchmark for architects, developers, and material buyers
Embodied CO₂ emissions are one of the most important indicators in sustainable construction. After establishing EPDs in Part 1, this article examines CO₂ emissions as the second fundamental metric for benchmarking materials. It explains where emissions come from, how they compare across materials, and how professionals in the US, UK, Germany, and Spain use CO₂ data for decision-making and certification compliance.
Understanding Embodied CO₂
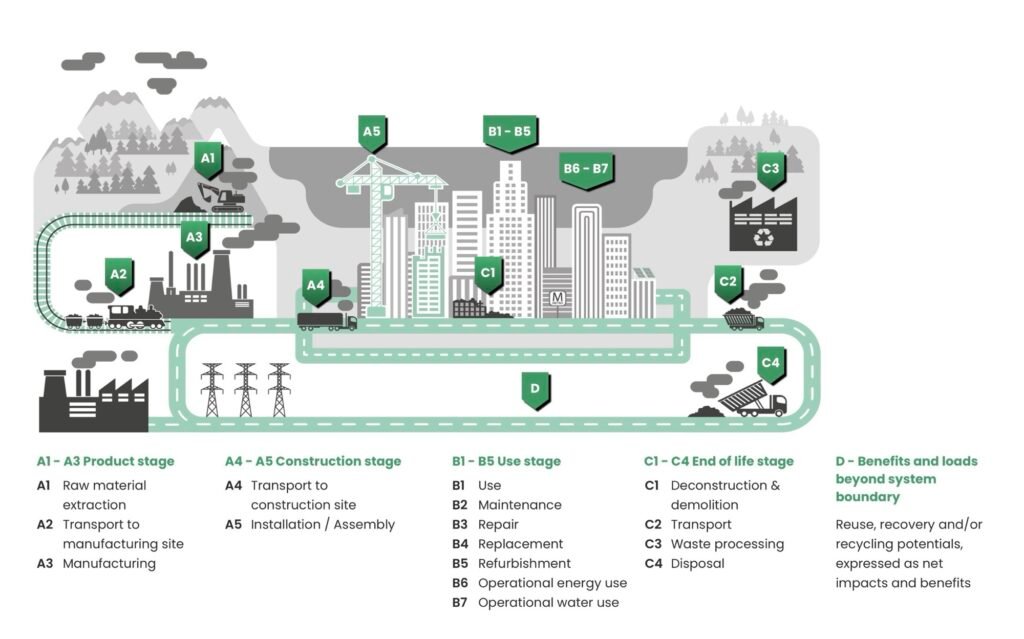
What you see: A simplified lifecycle assessment diagram showing stages such as raw material extraction, manufacturing, transport, installation, use, and end-of-life.
Why this matters: It visually highlights that embodied carbon originates across multiple stages of a product’s life, with the largest share usually concentrated at extraction and manufacturing.
Embodied CO₂ includes emissions generated before a building is operational: extracting raw materials, transforming them into products, transporting them, installing them, maintaining the building, and finally dismantling, recycling, or disposing of them.
The construction industry typically uses cradle-to-gate values (A1–A3) because they capture most emissions and allow comparison across manufacturers and countries. Cradle-to-grave adds A4–C4 modules, such as installation and end-of-life, but varies widely by project.
CO₂ Emissions Across Major Material Categories
Cement & Concrete
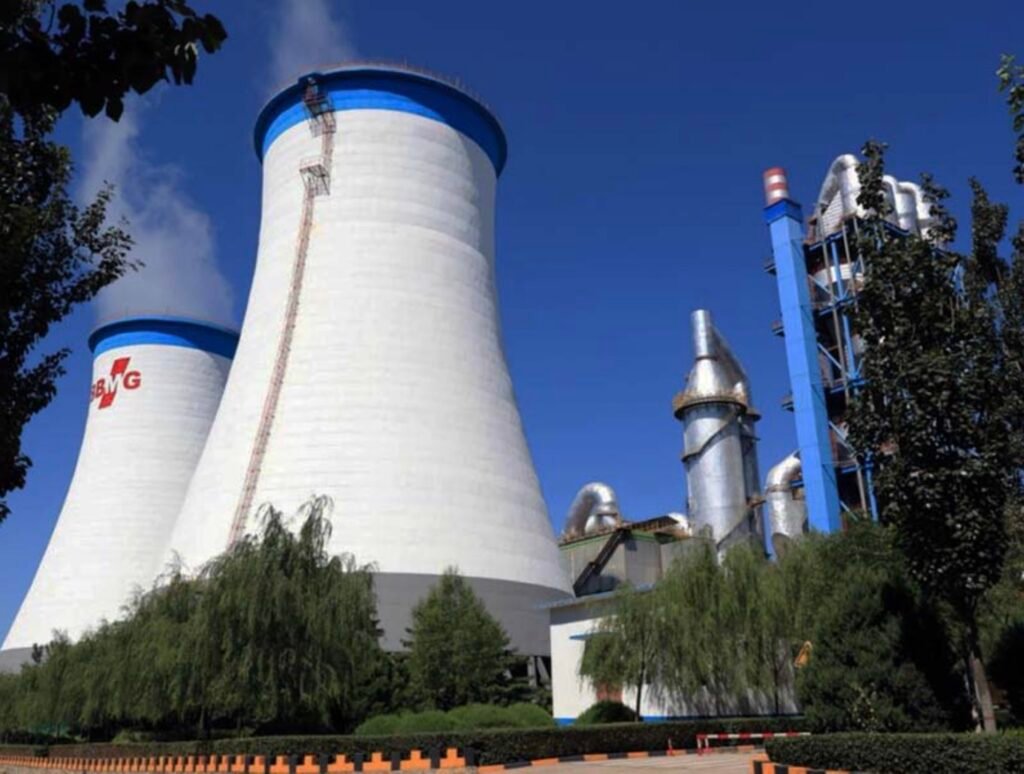
What you see: A cement plant with tall chimneys releasing exhaust during clinker production.
Why this matters: Cement production is one of the world’s largest industrial emitters. The image helps illustrate the scale and intensity of cement-related CO₂ emissions.
Concrete is responsible for about 8% of global CO₂ emissions. This is mainly due to the production of clinker, an energy-intensive process requiring temperatures above 1400°C. Chemical reactions during this process release additional CO₂ beyond fuel combustion.
Across regions, typical CO₂ benchmarks include:
Portland cement: 820–900 kg CO₂/t Concrete mixes: 250–400 kg CO₂/m³
The UK and Germany use more blended cements; Spain and the US have higher averages due to clinker ratios and energy mix.
Steel
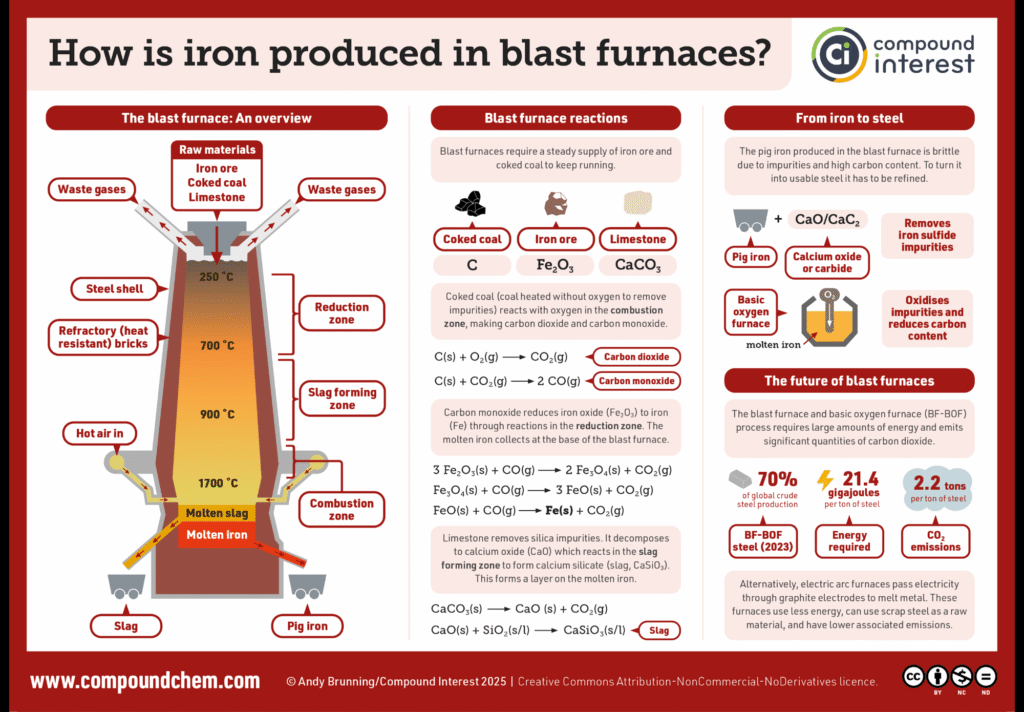
What you see: A blast furnace with molten steel pouring from the tap hole and thick industrial exhaust.
Why this matters: This is the traditional steelmaking route (BF/BOF), which is extremely energy-intensive and emission-heavy.
Steel is vital for large structural spans but also highly carbon-intensive:
Blast furnace steel: 1.8–2.2 t CO₂/t EAF recycled steel: 0.8–1.2 t CO₂/t
Germany and the UK increasingly use EAF steel due to higher recycling rates and greener electricity. The US has substantial EAF capacity, making recycled steel a powerful low-carbon choice.
Clay Bricks
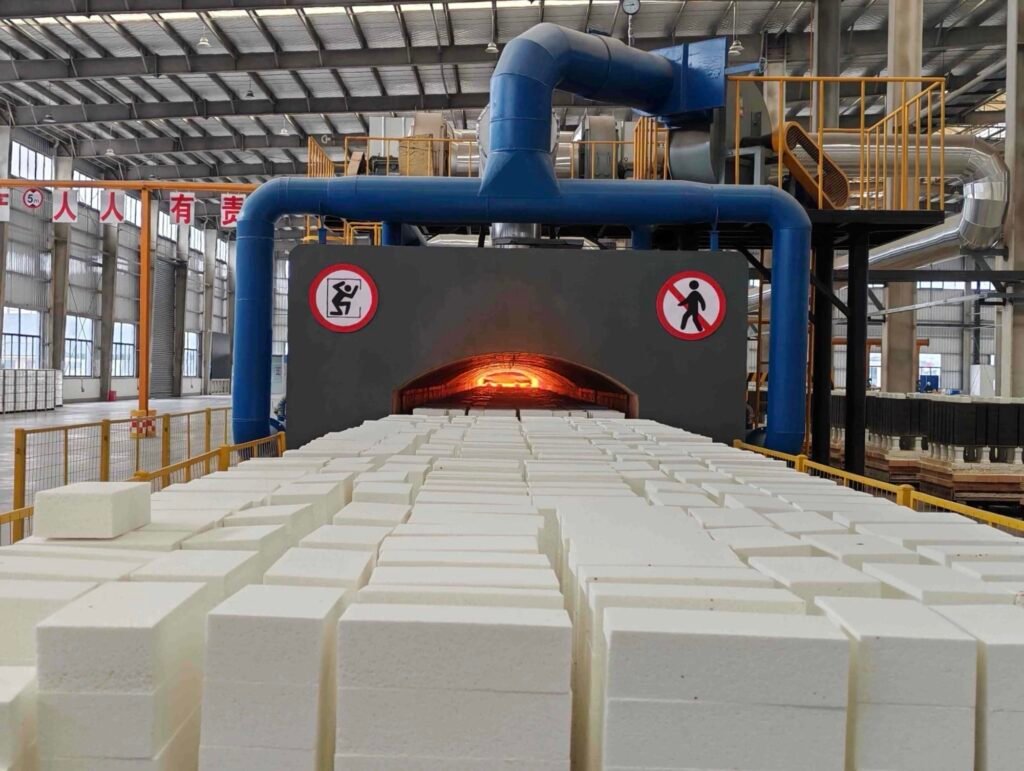
What you see: A traditional brick kiln with rows of clay bricks entering a firing chamber heated to over 1000°C.
Why this matters: Kiln firing is the primary source of CO₂ in clay brick manufacturing.
Clay bricks typically emit 150–200 kg CO₂ per tonne, mainly because of high-temperature kiln firing.
Reclaimed brick, however, can reduce emissions by over 95% — sometimes down to 2–5 kg CO₂ per tonne in the UK’s reuse market.
Mass Timber (CLT, Glulam)
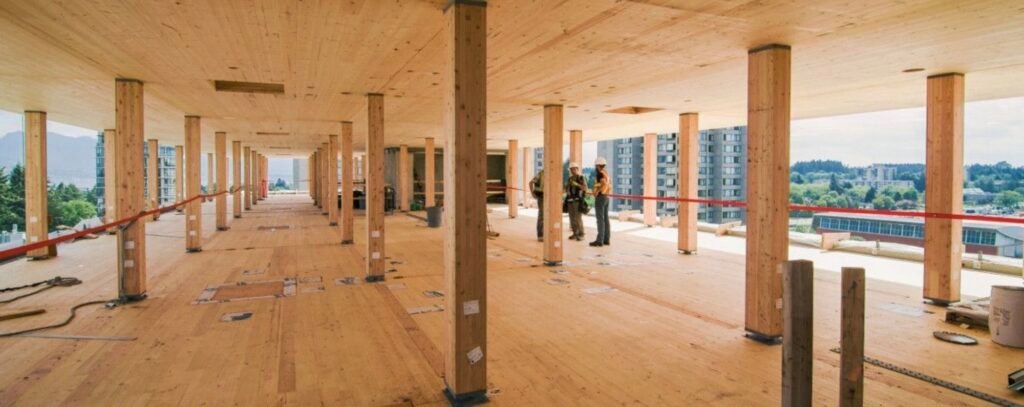
What you see: A mass timber superstructure showing CLT floor panels and glulam beams being installed.
Why this matters: Timber stores carbon rather than emitting it, making it a standout low-carbon alternative.
Mass timber has lower production emissions and stores biogenic carbon absorbed by trees. In many EPDs, CLT shows net-negative cradle-to-gate CO₂, depending on accounting rules.
Germany, Austria, the UK, and now the US lead in mass timber use. Spain is rapidly catching up with new mid-rise timber projects.
Recycled plastic Bricks (TheBrickLogic)
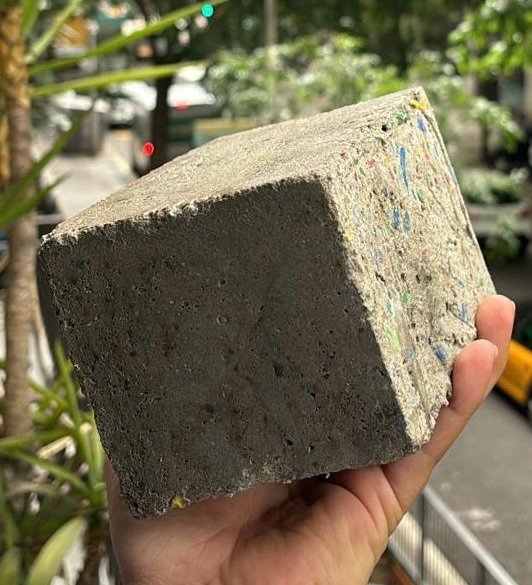
What you see: Clean, processed recycled ecological brick made from thebricklogic.com
Why this matters: Recycled plastic brick production begins with collected and cleaned waste plastic that is reshaped without high-temperature firing or cement.
Recycled plastic bricks avoid all high-emission steps found in concrete and clay:
No cement → no clinker emissions No kiln → no firing CO₂ Made from 100% recycled plastic Low-energy manufacturing
Total emissions are typically 50–60% lower than clay or concrete blocks.
Where CO₂ Emissions Concentrate
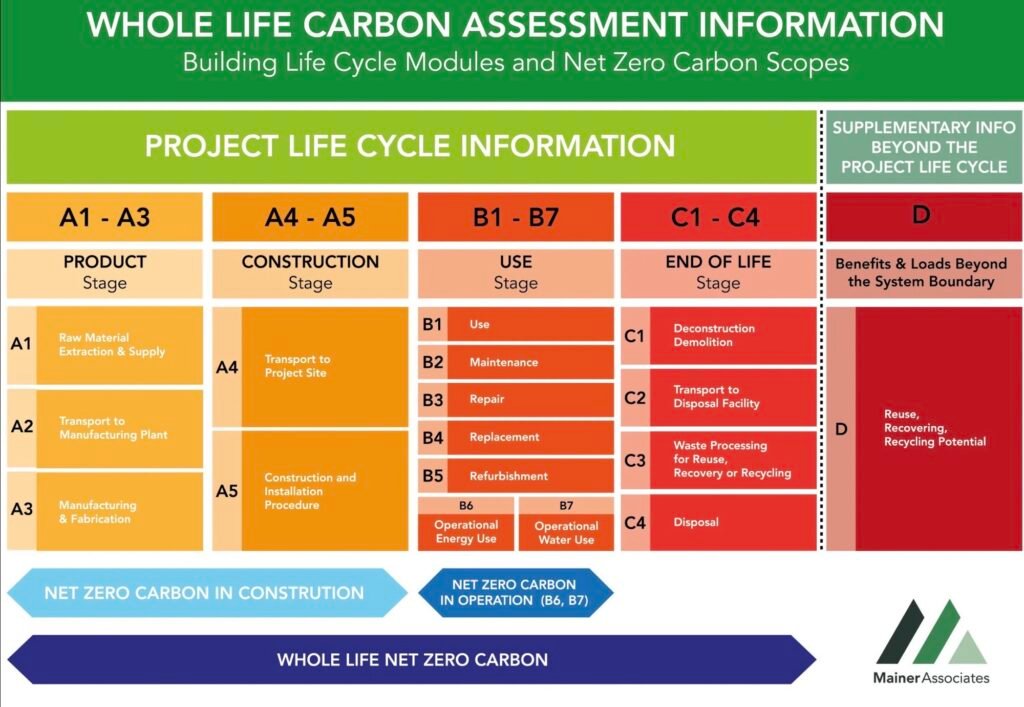
What you see: A modular diagram showing life-cycle stages A1–A5 and C1–C4, highlighting A1–A3 to indicate their dominance in CO₂.
Why this matters: It reinforces that most emissions occur during raw material extraction and manufacturing.
Most embodied CO₂ comes from the A1–A3 stages:
Extraction Processing Manufacturing
Transport (A4) adds emissions based on distance and weight. Installation (A5) usually contributes far less.
End-of-life (C1–C4) varies significantly: recycling steel yields credits, wood stores carbon, and reused bricks emit almost nothing.
CO₂ Assessment Tools Used in Construction
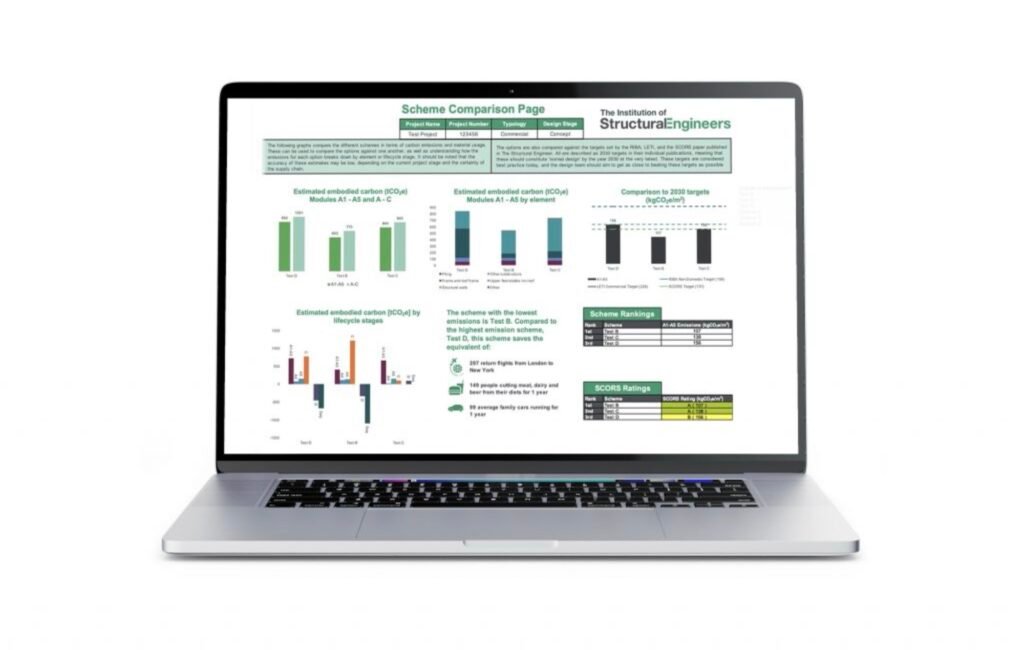
What you see: A laptop displaying the EC3 dashboard with material categories and CO₂ intensity values.
Why this matters: EC3 is one of the main tools architects use to compare the carbon impact of different materials.
Professionals rely on modern LCA and carbon-calculator tools:
EC3 for product-level carbon comparison One Click LCA for whole-building LCA in LEED/BREEAM/DGNB Tally / TallyCAT for BIM-integrated carbon assessments Athena and eTool for North American and global LCA coverage
These tools integrate with databases like ICE (UK), ÖKOBAUDAT (Germany), and LCA Commons (USA) to calculate accurate cradle-to-gate CO₂ values.
Regional CO₂ Differences: US, UK, Germany, Spain
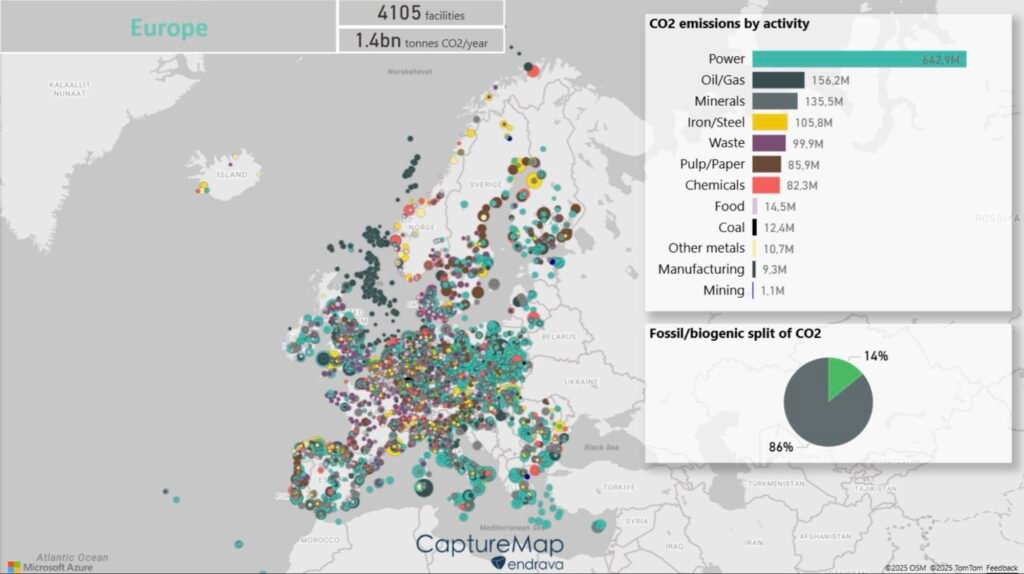
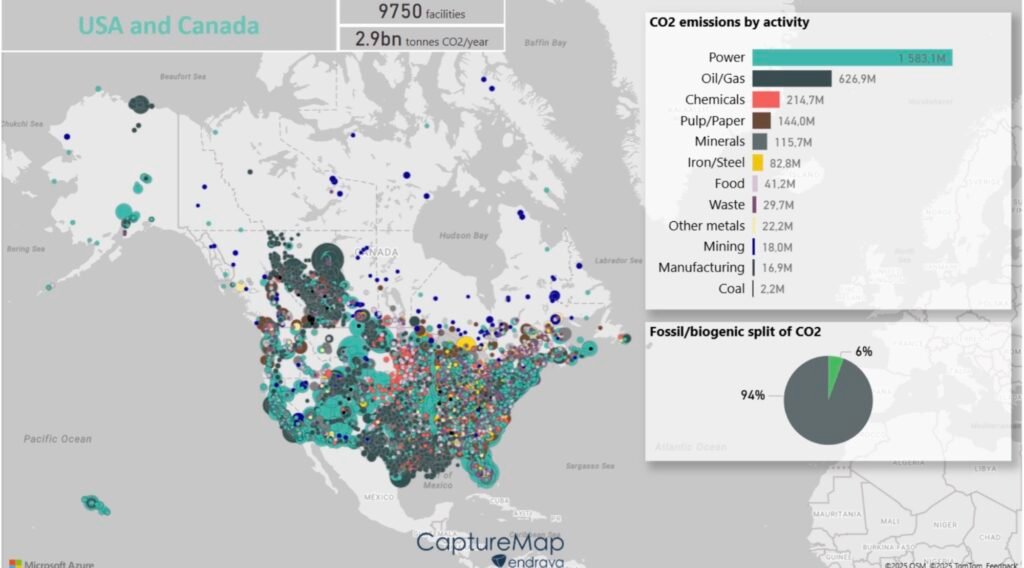
What you see: A simplified world or regional map showing CO₂ intensity differences in construction materials across Europe and North America.
Why this matters: Regional production methods and energy grid differences directly influence cradle-to-gate material emissions.
US: High cement intensity but strong EAF steel capacity UK: Advanced brick reuse markets and blended cements Germany: Strong timber adoption and high recycling rates Spain: Higher cement emissions but improving renewable energy mix
Policies such as Buy Clean (US) and mandatory EPDs (EU) push these regions toward lower-carbon materials.
Role of CO₂ Emissions in Green Building Certifications
Green building systems rely heavily on embodied carbon benchmarks:
LEED (US): Whole-building LCA, low-carbon materials credits BREEAM (UK): Strong emphasis on LCA and carbon reduction DGNB (Germany): Strict lifecycle CO₂ performance thresholds VERDE (Spain): EU Level(s) alignment with mandatory CO₂ reporting
Lower-carbon materials directly increase certification scores.
Coming Next (Part 3)
The third article covers Recycled Content Benchmarking, exploring:
Recycled vs virgin CO₂ impacts Circularity scoring Country-specific recycling regulations How recycled plastic bricks outperform clay and concrete How recycled content strengthens LEED/BREEAM/DGNB/VERDE submissions
SOURCES
USGBC – LEED
BREEAM – BRE Group
DGNB – German Sustainable Building Council
VERDE – Green Building Council España
IPCC AR6 – Buildings Chapter
https://www.ipcc.ch/report/ar6/wg3/chapter/chapter-9/
UNEP GlobalABC
https://globalabc.org/resources/publications/global-status-report-buildings-and-construction
UK Concrete Centre
https://www.concretecentre.com/
CEMBUREAU
World Steel Association
https://worldsteel.org/steel-by-topic/climate-action/
Brick Development Association
ICE Database
ÖKOBAUDAT
LCA Commons
ECO Platform EPD Database
https://www.eco-platform.org/epd-data.html
EC3
https://www.buildingtransparency.org/ec3
One Click LCA
Tally / TallyCAT
https://www.buildingtransparency.org/tally/
Athena Impact Estimator
eTool LCA